This video covers the basic flow from selecting a Typeform survey to getting results.
A few tips:
- Most green items are clickable
- To easily see what report does, click the
 button next to it, or click the report name and then click the thumbnails for more detail
- Reporting options depend on the structure of your typeform and vary from survey to survey
- Select output format by clicking the green entry in the Output column, eg Web page, Word, PowerPoint or images
- Configure ReportGorilla using the Settings and My Account items on the account drop down
- ReportGorilla loads and examines your survey only once, unless you change your questions or do a reset
Email us here for support (or get in touch using chat)
Create a ReportGorilla account
The post Effortless Typeform reporting In Action appeared first on ReportGorilla.]]>ReportGorilla creates beautiful reports from your typeforms in an instant. It uses built-in expert knowledge and automation to create professional reports and presentations in a variety of styles and outputs from Typeform data.
Instant Reports for Typeform
Save time and get access to powerful reporting for your typeforms at the press of a button. Create your reports as web pages, as Word, PowerPoint or Excel documents you can edit, or as collections of charts/table images you can use anywhere.
You don't need any technical or analytical know-how to use ReportGorilla. It's report creation by pictures. Just point to what you want and let ReportGorilla do the heavy lifting.
How does it work?
ReportGorilla examines your typeform and shows the reporting options that work well with it.
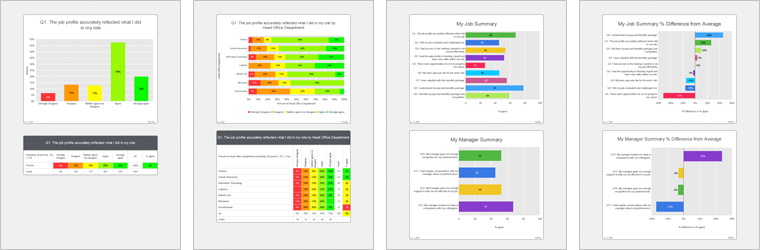
Then you can discover the possibilities with just a few taps.
Browse report options, view thumbnails, read about any report and create realistic previews.
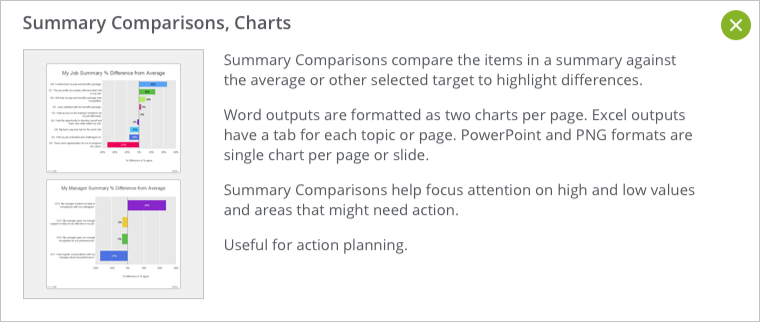
How will my Typeform report look?
ReportGorilla Previews show you exactly how your report will look, using realistic test data. This is a powerful learning tool that removes uncertainty. Previews are free, so you can try before you buy. Every time. Previews also makes it easy to discover different useful ways to look at your typeform data that you may not have thought of. Find the stories you didn't know you had.
No subscription - Only what you need and nothing that you don't
There is no subscription. You pay only for the reports you create with real data. Just add reports to your basket and they will be instantly created when you check out. That's it!
Conveniently find all your completed reports on the My Reports page. From there, you can easily view, share, bulk download or delete your survey reports, so you are confidently in control.
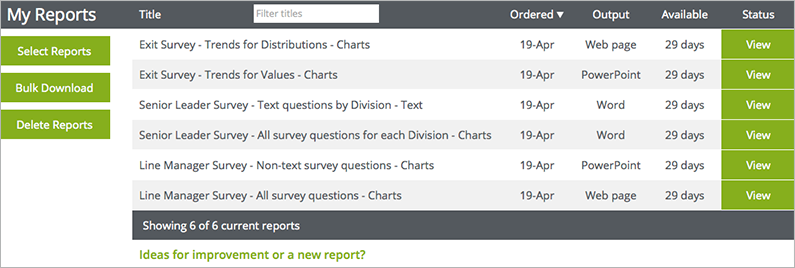
View and share with ease
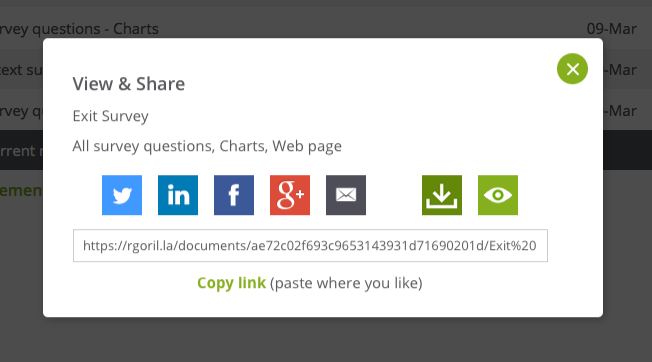
In My Reports, click any View button to open the View & Share panel. With a click or two, you'll be done.
Try it out. It's easy
If you're already a Typeform user, you can immediately discover what ReportGorilla can do with your surveys by trying it now, FREE.
See it in action in this short intro video, so you can see how easily ReportGorilla can help you get more value from your survey data.
The post Effortless Reporting for Typeform Surveys appeared first on ReportGorilla.
BrainFx is an innovative Canadian company specializing in assessment of brain health to determine areas of cognitive strength and challenge. BrainFx provides digital cognitive assessment tools to clinicians across Canada and the US.

Like many companies, BrainFx faced challenges from the effects of Corona Virus. The changes in behaviour that have followed had health care teams quickly pivoting to providing virtual care instead of in-person care. CEO Tracy Milner and her team decided that remote automated assessment was the best way to enable their existing clients to continue offering their assessment services in this "new normal" environment.
Corona Virus drives Innovation
BrainFx's solution was to use video for the assessment and a specially designed white-labelled SurveyMonkey survey to guide the process and collect responses. More and more people now have access to video and BrainFx got to work creating the assessment in SurveyMonkey in order to be able to rapidly deploy the assessment to BrainFx customers. The big challenge appeared in the reporting phase, because standard survey reporting is not geared up to report on individual responses, which is what BrainFx needed for their solution.
"We set about looking for a solution and found ReportGorilla, who had the ability to create the detailed and customized assessment reports we needed and had the expertise to string the whole process together into a seamless experience."
BrainFx Virtual Care - Automated Assessment
BrainFx Virtual Care Assessment (VCAx) launched at end of April, two weeks after initial contact with ReportGorilla. Clinicians across Canada are now using BrainFx VCAx every day to remotely assess cognitive impairment and use the BrainFx Virtual Care reports to support planning of care programs for patients.
The BrainFx reports are securely delivered to clinicians a minute of two after they submit their survey responses.


The BrainFx Virtual Care launch release said:
"The challenge currently for healthcare professionals working in cognitive rehabilitation is that most traditional cognitive assessments are not designed nor validated for virtual care administration.
We are so excited to be able to offer this much needed innovation to health professionals everywhere. We hope that it can serve well during this time of physical distancing."
CEO Tracy Milner added: " ReportGorilla clearly addressed the gap between assessment with the individual and reporting for the clinician. ReportGorilla exceeded our expectations with respect to collaboration, professionalism, customizability, flexibility to meet requirements for healthcare, and delivery on-time. We would not hesitate to recommend them."
More Information about Automated Assessment and BrainFx Virtual Care
ReportGorilla Automated Assessment details & Demo
The post Automated Assessment Case Study - BrainFx appeared first on ReportGorilla.
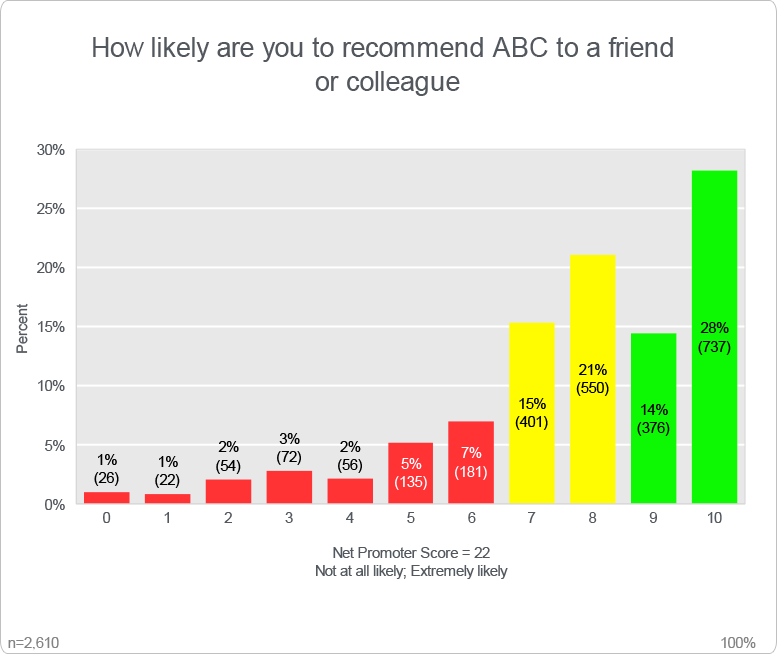
NPS is 22.
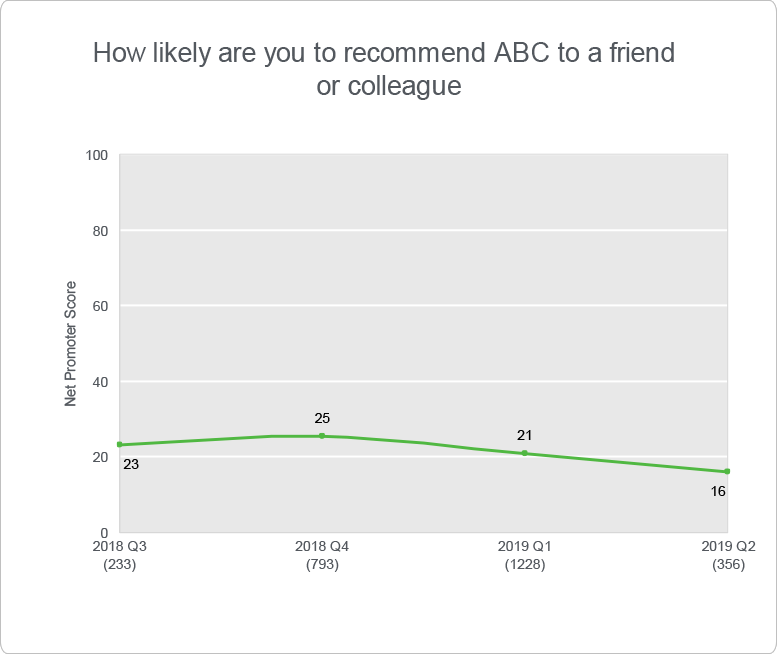
It seems their score has been getting worse.
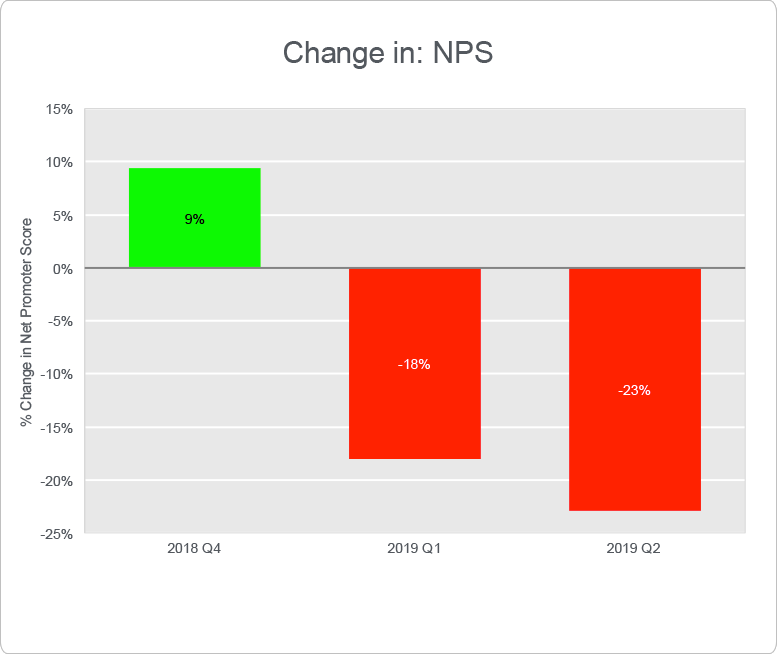
This change chart makes it look very dramatic. Clearly, we need to understand this better.
To decide what action to take, we need some context, specifically, what can we influence and how actions should be targeted.
The survey also contained a question asking what main thing users find most frustrating with the product.
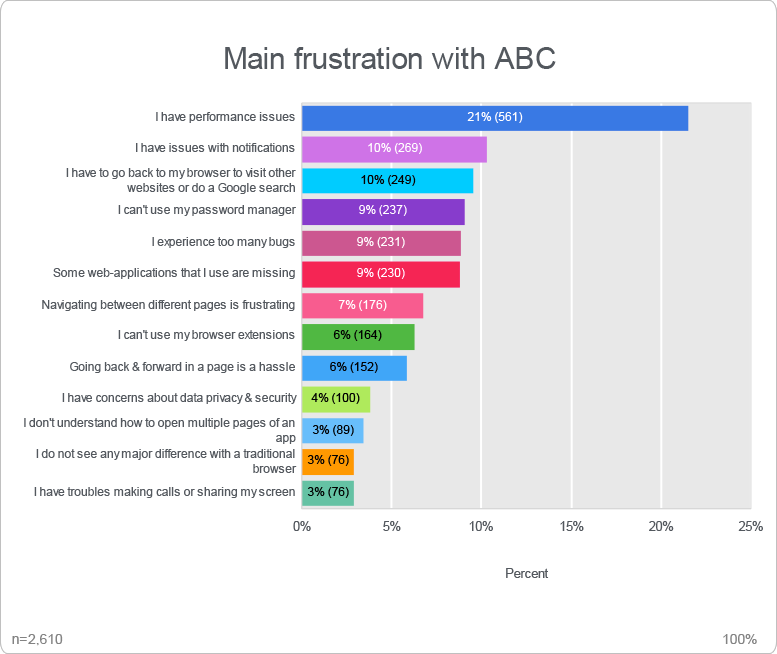
Looking at these answers, the temptation is to act on the thing most people mention as their main frustration and work down the list.
That could be the right thing to do, if the goal to keep most people happy. It might also improve the Net Promoter Score, but is there a different way of looking at this?
It may be that users still promote the product to friends and colleagues despite having frustrations with it.
By segmenting the overall NPS score by Main frustration, we can see what score is associated with each main frustration. Some frustrations clearly have greater NPS impact than others.
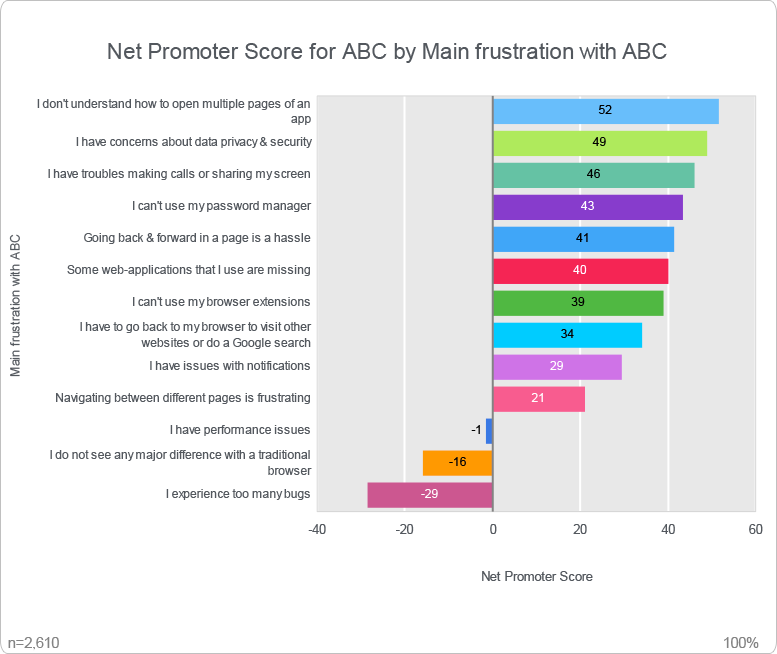
This gives a different input into the decision about what areas to focus on. Drilling into more detail for each item gives us a better picture.
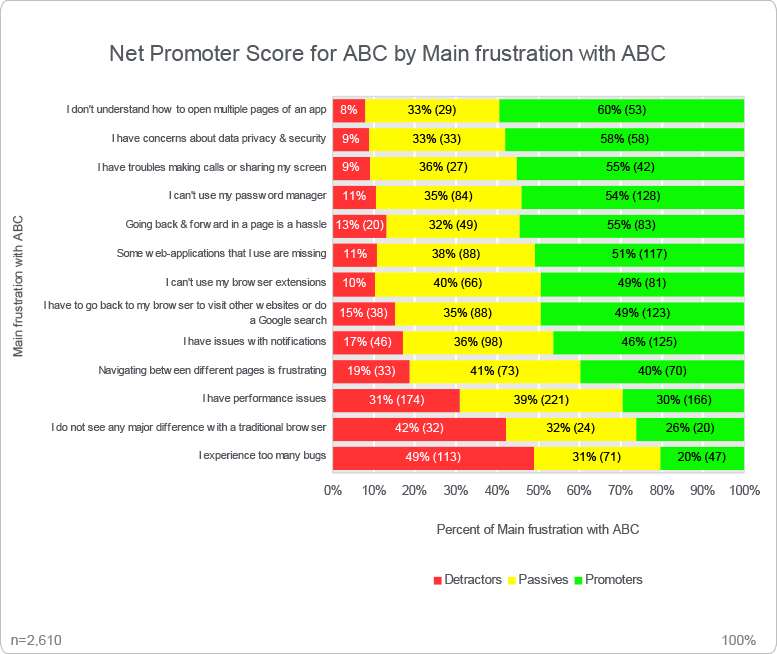
Should the focus be on clearer communication, on better testing and quality assurance, on optimising system performance or on adding new features?
Now you can have an informed discussion about what actions will most effectively deliver the outcomes you want.
(You may want to take this further and work out the cost of addressing an individual frustration and the resulting benefit expected to offset it, but that's beyond the scope of this post and a topic for a future one.)
Using NPS together with other questions can help highlight areas in which actions can make a significant difference on NPS outcomes, leading to more effective action.
Reportgorilla's NPS questions by all demographics report type makes it really easy to do this type of analysis.
Including the right questions in your survey
To be able to this type of analysis the right questions need to included in the survey. It can be hard to anticipate the future analysis requirements when busy designing a survey.
ReportGorilla's Report Preview feature can help with this. It lets you test your reporting options before you have collected any data, i.e., when you are designing your survey.
Read about how report previews help design better surveys
ReportGorilla suggests useful reports automatically
If your survey contains one or more NPS questions, and one or more "demographic" or categorisation questions (ie, select a single answer from a list), ReportGorilla automatically presents the NPS questions by all demographics report type as an option for your survey.
Read more about the NPS by all demographics report
The post Smart NPS Analysis - how to take the next step appeared first on ReportGorilla.
Surveys are used in a huge number of different scenarios, but there are some recurring themes in survey reporting. A few are described below and may trigger some ideas for your own survey reporting. You can click the green links at end of each description to read more about the reports used.
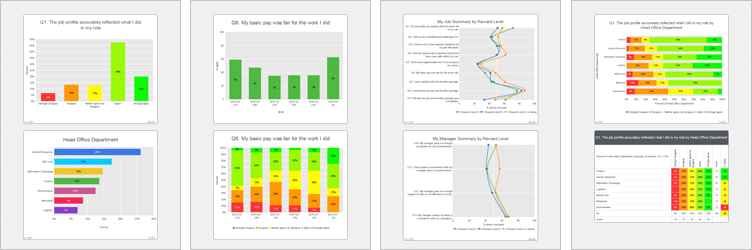
As you discover more survey reporting and analytics options, you will think of new potential uses to apply to your surveys. The ReportGallery is a powerful way to trigger your creativity and kick-start your thinking. In the meantime, here are some survey reporting scenarios you might recognise.
Some survey reporting scenarios
- The executive's PA walks by and and says they are having a meeting in 10 minutes - can you share some headlines from the current survey? Sigh ... typically last minute ... but, no problem for you. Sure! Summary questions to PowerPoint, email to the PA. Done in a minute ... more about summary questions
- The main engagement survey report covers the whole company, but you need individual reports for each division (and maybe for each location and team). Make a 'for-each' report for each division (or any other category you may need to have separate reports for). A for-each report creates a separate report for each category using only that category's data. You can relax and let ReportGorilla do the heavy lifting. "It took you how many minutes to create all those reports???" "You're kidding? Then perhaps you could also..." More about All questions for-each reports
- The exec team now would like to compare results across divisions without having to wade through all the different divisional reports. Easy. For a higher level comparison, try Summary questions by Category, or for a more detailed view, try All questions by Category.
- You have been asked to find themes and patterns in the survey data. Hmm. Interesting challenge. Some issues are division related and require specific local action. Other issues are broader and warrant company-wide action, like a training program. See the patterns at a glance with an 'Overall Table by Division' report that heat-maps results by question AND Division. ... more about Overall Ratings table by Category
- The HR team wants to see the results by Pay Grade. (Word is spreading ... ) Choose All questions by Pay Grade. (Stand by for requests for data cuts by years of service and Job Role as well as by Country to see if there are cultural differences.) ... more about summary question profiles by category
- Each location manager is running an action planning session based on the staff survey results. How can we help them to focus on the main issues at that location and make the sessions more engaging and effective? A Comparative Summary report for each Location would show results by question within each each topic (e.g. My Job, My Team, My Manager) etc. Really useful for increased understanding and to inform discussions. What needs action? What can be celebrated or even shared as good practice. More about comparative summary questions
- You are in a meeting and are asked to make some impromptu comments about the current survey. You have your phone with you. Open the survey in ReportGorilla, select Summary Questions in PowerPoint and transmit it to the projector from your phone. Finish off by emailing attendees your slides so they can review them at their convenience when back at their desks. Get kudos for being a whiz with surveys. ... more about summary questions
Different types of reports work for different purposes. With ReportGorilla, it's easy to choose reports that match your needs and get them done right away with minimum effort.
Need a special report?
If you can't find a report that suits your requirements, let us know and we'll be delighted to help you find a reporting solution that does what you need, or create one for you.
Tell us about your report requirement
The post Common survey reporting scenarios appeared first on ReportGorilla.
So, why not get feedback about how the reporting for your current survey design will look?
Better still, why not get this feedback before you collect any answers?
This image tells an all to common story:
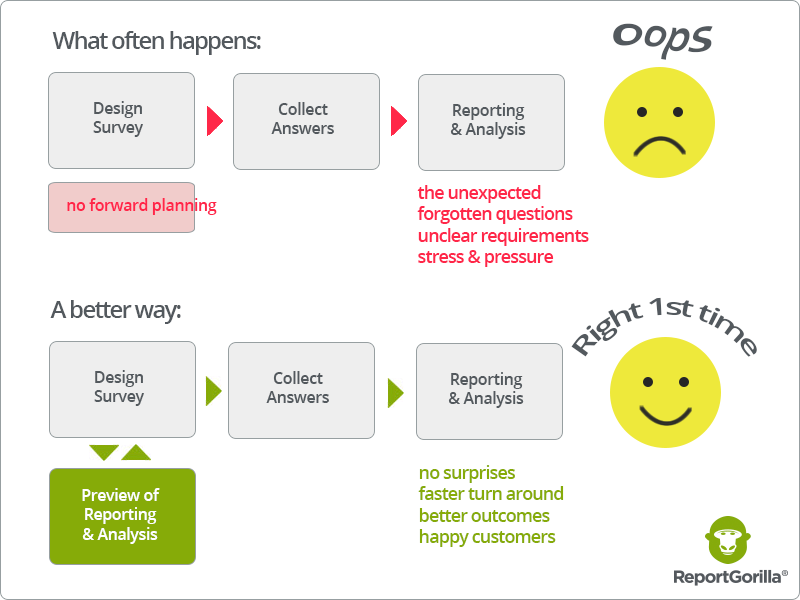
When you see how reports will look while while designing the a survey, you'll be able to refine and improve it as you go and create a better survey before you launch.
Report previews help you ensure that your survey really does let you draw the types of conclusions you intended before passing the point of no return. That way, you can be confident it really delivers and meets expectations. No more “I wish we had asked this differently” or “We should have included this question too”.
Extending the scope of pre-launch testing
The typical advice for checking a survey before sending it out focuses on using appropriate question types, clear wording, making sure it works correctly and looks good. These are clearly important things to be on top of. There are many articles available on this, including this Survey Confidence Checklist highlighted in SurveyMonkey's May 2017 Newsletter.
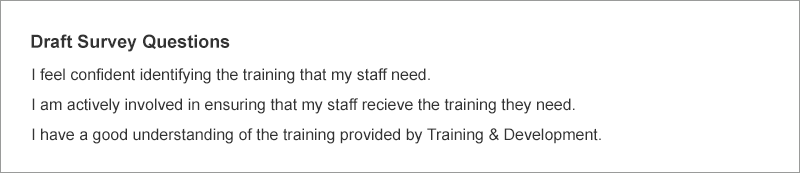
Draft questions are often circulated for vetting and approval by listing them in an email or document, e.g.:
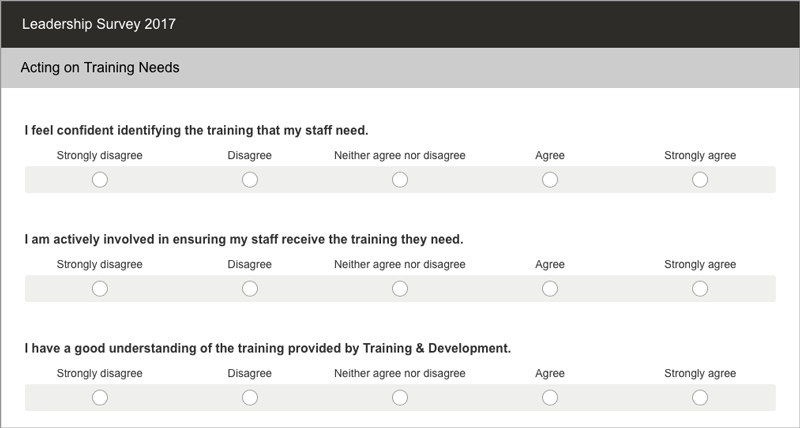
Sometimes, feedback on the survey design is collected by letting reviewers see the draft survey, for example using SurveyMonkey's testing and collaboration features:
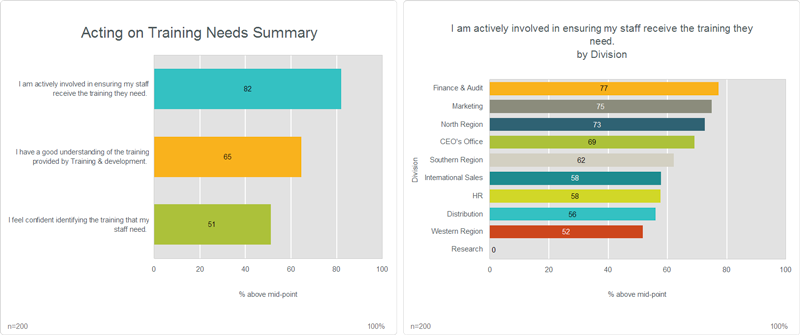
While is useful, why not take it all the way and show what reports and presentations will actually look like? There are real benefits from previewing reporting while you are designing your survey, e.g., like this:
Or, "Would this summary of questions by Division that shows patterns and differences work for you?".
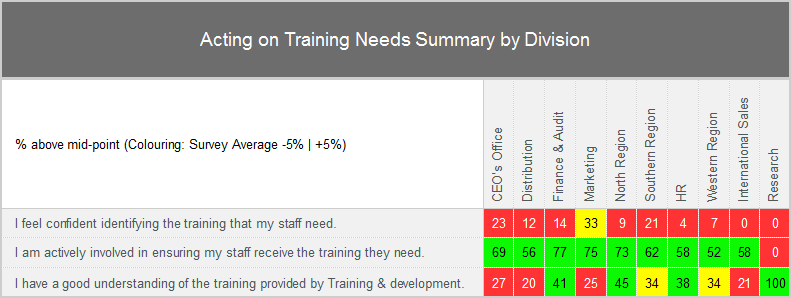
"Hmm ... to understand that better, we should also ask about ...", and so, the report preview creates useful insights before any answers are collected.
Engaging survey customers and decision makers early
The first effect of seeing previews of reports in advance is that we discover and detect things that are not apparent to us from looking at questions alone. To use some analogies, we don't experience the taste of food as well from a menu or a list of ingedients as we do when we actually eat it. Or when we try to imagine what a new home is like from list of components and blueprints, compared with actually stepping into it.
In addition to better survey design, there are other important benefits from using report previews.
It lets customers and decision makers:
- engage earlier, by being able to visualize potential outcomes and decision options more clearly
- sign off on the design in terms of the reporting outcomes they want (the reports) rather than only on the tools to collect the information (the questions)
- act more quickly once answers have been collected, because they have been mentally pre-briefed
It's sometimes hard to get engagement from busy decision makers by showing them lists of questions. But try showing them possible results and watch their level of interest change.
It's important to engage and bring decision makers with you in the survey process to get the most benefit from the survey effort. Indeed, from any analytics activity. In reality, how often do results just get filed away or forgotten because the decision maker was not involved or engaged?
Better decisions faster
In summary, previews lead to better survey designs and reports as well as to more engagement. This in turn results in better and faster decisions.
Since ReportGorilla previews are FREE, why not take this opportunity to improve to your surveys?
Try ReportGorilla with your surveys now
The post Better Survey Design with Report Previews appeared first on ReportGorilla.
So too with surveys. The key to an effective survey is being clear about its purpose.
Surveys are a means to an end rather than an end in themselves. Why are you running this survey? What makes a survey effective is the extent to which it contributes to achieving that end.
For example, is the purpose to:
- reduce staff turnover and recruitment costs?
- change employee behaviour to be better able to deliver the new company vision?
- identify opportunties for process improvement and good practice to share?
- check if messaging is getting through to all the right people?
- something else?
Clear thinking about WHY is crucial to creating and running an effective survey.
Measurement is an act of selection
We don't always think about that measurement is an act of selection. By choosing to measure certain things, we lift them out of the background and draw attention to them. What we don't measure remains hidden. That's why asking the right questions is so important. By bringing certain things into focus, we also send subliminal messages.
Surveys are two way communication
Surprisingly perhaps, surveys are two-way communication. Of course they are about collecting information, but every survey also communicates more subtle meanings to everyone that sees it. It says: This is what we think is important, this is how professionally (or not) we go about our work. It says: This is the extent that we actually value you and seek to engage with you and include you in what we are doing.
Survey Process Steps
In the overall survey process, several steps contribute in different ways to survey effectiveness.
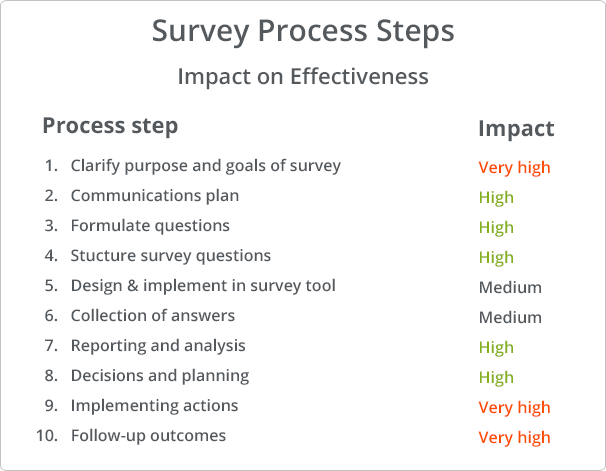
The table sets out the process steps and their importance in creating effective surveys. The assessment of impact is somewhat subjective and varies by survey. The purpose of the table is really to highlight that making effective surveys is about more than entering questions in a survey tool and collecting answers.
The list format is not meant to imply that it's a strict sequence of events with a beginning and an end. It's an continuous process where the last step feeds back into the first. There are also iterations along the way, looping back to earlier steps.
1. Clarity about purpose, goals and scope
Unless we know what the purpose of a survey is, the notion of effectiveness ("doing the right things") is not meaningful. The task of policy makers and leaders is to set goals and direction, and to clearly to articulate them.
A plan for a survey can also include specific actions to be taken. For example, for an engagement survey, that each team will discuss their results and agree an action plan for next 6 months.
2. Ongoing communication and communication plan
You need to bring people with you, whether they be employees, customers or suppliers. When the plan is clear, tell them. Why is the survey being run? What will be happening, what is expected of participants and why their support is crucial. How will the collected information be used?
Plan the communication at the outset and make it an integral part of the survey process, rather than hastily cobbling together a cover note when the survey is ready to be sent out.
3. Formulating questions
This can be hard. Experience obviously helps. Some say its an art.
There is plenty of advice on how to write good questions, so we won't cover it here. It's still worth emphasising that it's crucially important to be brief and clear. Make sure that each question is about only one thing. Beware of words like "and" and "or".
Standard question sets
A word of caution also about the use of standard sets of questions. There are situations where standard sets of questions are necessary and useful, for example when assessing personality or learning styles. A standardised measurement tool ensures consistency and comparability across a wide range of respondents.
In other situations, standard sets of questions may not fit well with a particular environment. A typical example is in benchmarking, where standard questions are needed to ensure comparability of individual results with a benchmark. It's a dilemma when standard questions are a not well matched with how things are done in your organisation. If unique and important circumstances are not taken into account by standard questions, they may not be the right ones to use in your case. This requires some judgement and trade-offs.
4. Structuring the survey questions
Grouping similar questions together makes it easier for respondents to focus while also providing a useful structure for reporting. Giving the grouping a title also helps set the context. For example: My Company, My Team, My Manager, Communication.
It is common to see a single open question like "Is there anything else you'd like to tell us about" at the end of a survey. Instead, consider having such an open ended question at the end of each topic. This captures thoughts while they are still fresh in the respondent's mind and also pre-sorts them for reporting purposes. For example, you will automatically get a collection of comments about "Communication" or "My Team".
5. Implementing the survey in a survey tool
There are many survey tools available with varying capabilities and at different price points. Using them is no different than learning to use any other application. They allow varying levels of control of the survey taking experience and presentation. A well implemented, nice looking survey has a positive effect on the experience of the respondent. A poor experience reflects badly on the sender of the survey and can effect responses rates.
Testing the survey is always important and many survey tools have means to run tests and get feedback before launch. Remember to remove any test responses from the data!
6. Carrying out the collection
This is about smooth execution, being easy to use and reinforcing the brand. It's also another opportunity to communicate. Provided the basics work, this is not usually crucial to survey effectiveness.
7. Reporting and analysis
Once answers are in, data analysis and reporting can begin. You will have set the stage for reporting and analysis in earlier stages when you formulated questions and structured your survey.
All too often, there is a realisation at this stage that questions could or should have been asked differently. Or that some additional questions should also have been included.
ReportGorilla has a useful learning feature that allows you to examine and test reporting options BEFORE any data has been collected. This means that already during the survey design phase, you can realistically experience what reporting will be possible for your current survey. This way, you can adjust your survey design until you can get the reporting that is needed. We all learn through feedback. Even survey designers!
It's also a great way to engage decision makers early in the process and get their sign-off before the survey is launched. You can read more about Better Survey Design with Report Previews here.
8. Decision making and action planning
This is about making reports and insights available to the people that are going to make choices and decisions. In some cases it may the very people that have done the analysis, in which case it's tightly coupled with the previous step.
In other cases, it's a question of making appropriate reports available to the right people. What reports depends on what choices or decisions they are required to make. There are a range of different scenarios and possibilities. You can read about some reporting scenarios here
9. Implementing the action
Collected data is useless unless you do something with it. Similarly, reporting and analysis is useless unless it results in some action or change of behaviour. (Drawing insights from the analysis and deciding not to take action can be a valid course of action.)
The key here is to have given some thought to what activities will take place when survey results are available already in the survey plan. And of course there is the unexpected insight which you are more likely to come across if it is easy to create different kinds of reports.
For example, one company's process required each team leader to discuss results with their team and agree what actions to take. Since there was follow up action planned, team leaders had a strong incentive to encourage team members to respond to the survey.
10. Following up on outcomes - How did things change?
This final step in the cycle is to assess the impact of actions taken as a result of the survey. Have they had the desired effect? The interval and frequency of follow-up depends on the lead time for actions to filter through to changes in behaviour or greater efficiency. If changes take a month to have an effect, it makes sense sense to get feedback in that timeframe rather than to wait a year for next survey. Why wait?
It could involve running a subset of survey questions again to see if there has been a change against the baseline measurement. Reports showing trends and change are useful for this.
Continuous improvement
Finally, in the spirit of continuous improvement: In one organisation, analysis showed that teams that had actively worked with survey results the previous year showed significantly greater improvement than those that had not. Stands to reason.
To improve the effectiveness working with results, steps were taken to facilitate action planning. Guidelines were written for team leaders and a special report was created for each team that showed top and bottom results for each topic. This made it easier for teams to engage with survey findings, discuss and take constructive action.
A process insight along the way that helped improve effectiveness.
* The quote is from Elliot Carver, the news tycoon villain from the James Bond film Tomorrow Never Dies.
The post How to make an Effective Survey appeared first on ReportGorilla.
The Report Gallery lets you explore and find reporting options for your surveys.
Or you can think of them as story templates.
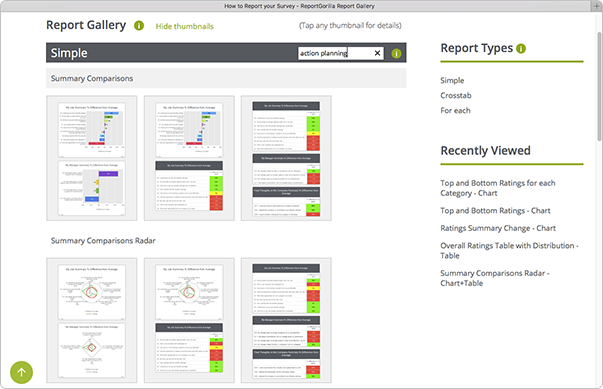
Open Report Gallery in a separate window to follow along
A good first step is to be clear about who your audience is and what their view or interest will be. What are the decisions and choices they need to make? What is it that you want to get across? With that as a starting point, it's easier to identify what reporting will help you tell the story in your data.
Start with the audience
Given your audience's focus, would that be best served by
- a representation of every question in the survey, including text responses?
- only the text responses, or charts and text separately?
- a summary of the responses by topic?
- a presentation, a report to distribute or a page to browse on the web?
Or would it be more helpful with
- an overview of trends or changes?
- comparisons of results for different categories against each other?
- comparisons of results against specific targets, to pinpoint high and low performance?
- or just getting charts to use in a custom report you are creating?
Whatever the focus, seeing different reporting and visualisation options will trigger your thinking. If you already know what you want, this can be a good starting point to find related reports and views to get more insights from your data.
What if I'm not sure what my audience's reporting priorities are?
This is not uncommon - and even they might benefit from some help with that too! A good way to find out is to get their involvement already during the survey design process. For ideas, you can read the blog post about getting feedback on survey reporting BEFORE you send out your survey.
Using the Report Gallery
Here are some ways in which you can use the Report Gallery to find reporting options:
- Browse the thumbnails to find formats that suit your needs
- Use the filter to search for keywords, like summary, trend, change, distribution or action planning
- Tap/click on individual thumbnails to drill down for more details
- See different formats of the same report
- Discover related reports by clicking reports in the the Related reports section on any Report Details page. (You can also move the mouse over the names of related reports to see a mini thumbnail to guide you.)
Let ReportGorilla help you choose
While the ReportGallery shows the full range of different report styles, ReportGorilla can use it's built-in intelligence to narrow down the options for you.
When you select your survey, ReportGorilla pre-analyses it and works out which reports are a good match. You can browse them, just like in the Report Gallery. To take it to a different level, you can also create fully realistic previews of these reports, as Web pages, PowerPoint, Word or Excel files you can edit, or just chart or table images you can use in other documents. This way, you'll see exactly how your reports will look and be able to proceed with confidence.
Once you have found the reports or slideshows you want, you can instantly create versions using your real data and be ready to share findings, gain insights and make better decisions.
Try ReportGorilla with your surveys now
New insights from old data
You can try previews with your old surveys too. It's a great way to see what ReportGorilla can add and you may even gain some new insights from that old data. It's never too late to learn.
The post How should I report my survey? appeared first on ReportGorilla.
ReportGorilla is an easy to use, cloud based survey reporting service for SurveyMonkey surveys. It uses built-in expert knowledge and automation to effortlessly create professional reports and presentations in a variety of styles and outputs from your survey data.
Easy to use - professional results fast
You will save time and get access to powerful reporting capabilities at the press of a button. Create your reports as web pages, as Word, PowerPoint or Excel documents you can edit, or as collections of charts.
You don't need technical or analytical know-how to use ReportGorilla. It's report creation by pictures. Point to what you want and let ReportGorilla do the heavy lifting.
How does it work?
When you select a survey, ReportGorilla loads and examines it and shows you a range of reporting options.
Now you can browse report options, view thumbnails and read descriptions.
Previews - Try before you buy
With ReportGorilla Previews, you'll see exactly how your report will look, using realistic test data. This is a powerful learning and refinement tool that removes uncertainty. Previews are free, so you can try before you buy. Every time. Preview makes it easy to discover different useful ways to look at your survey data.
It's so easy - so you'll learn faster
Since it's easy, you'll get instant feedback on the choices you make. You'll quickly become more aware of reporting options, learn faster, and make those discoveries before anyone else. And it's fun too.
No subscription
There is no subscription. You pay only for the reports you want. Just add reports to your basket and they will be instantly created when you check out. That's it!
All your completed reports are conveniently available on the My Reports page. From there, you can easily view, share, bulk download or delete your survey reports, so you are confidently in control.
View and share with ease
In My Reports, click any View button to open the View & Share panel. With a click or two, you'll be done.
Try it out. It's easy
If you're already a SurveyMonkey user, you can immediately discover what ReportGorilla can do with your surveys by trying it now, FREE. And if you're not a SurveyMonkey customer, or want more information, you can watch this short intro video, so you can see how easily ReportGorilla can help you get more value from your survey data.
Note: SurveyMonkey requires that you have an annual plan to access your survey answers this way. The good news is that with ReportGorilla, you can create and view report previews with any SurveyMonkey plan or survey.
Try ReportGorilla with your surveys now
The post ReportGorilla meets SurveyMonkey appeared first on ReportGorilla.
This video covers the basic flow from selecting a survey to getting results.
A few tips:
- Most green items are clickable
- To easily see what an item does, click the button next to it
- Reporting options depend on the structure of a survey and vary from survey to survey
- Configure ReportGorilla using the Settings and My Account items on the account drop down
- ReportGorilla loads and examines your survey only once, unless you change your questions or do a reset