Create Account

How should I report my survey?
I've run my survey - what do I do now?
What story would you like to tell?
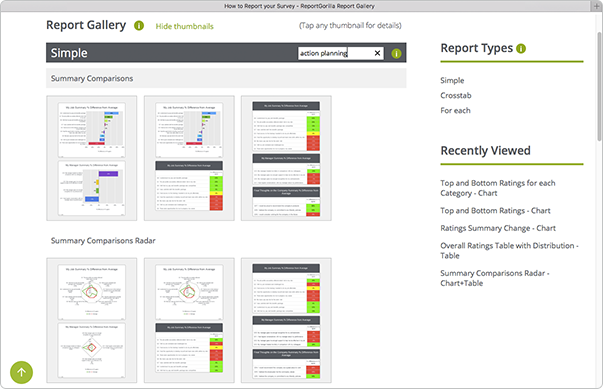
The Report Gallery lets you explore and find reporting options for your surveys.
Or you can think of them as story templates.
Open Report Gallery in a separate window to follow along
A good first step is to be clear about who your audience is and what their view or interest will be. What are the decisions and choices they need to make? What is it that you want to get across? With that as a starting point, it's easier to identify what reporting will help you tell the story in your data.
Start with the audience
Given your audience's focus, would that be best served by
- a representation of every question in the survey, including text responses?
- only the text responses, or charts and text separately?
- a summary of the responses by topic?
- a presentation, a report to distribute or a page to browse on the web?
Or would it be more helpful with
- an overview of trends or changes?
- comparisons of results for different categories against each other?
- comparisons of results against specific targets, to pinpoint high and low performance?
- or just getting charts to use in a custom report you are creating?
Whatever the focus, seeing different reporting and visualisation options will trigger your thinking. If you already know what you want, this can be a good starting point to find related reports and views to get more insights from your data.
What if I'm not sure what my audience's reporting priorities are?
This is not uncommon - and even they might benefit from some help with that too! A good way to find out is to get their involvement already during the survey design process. For ideas, you can read the blog post about getting feedback on survey reporting BEFORE you send out your survey.
Using the Report Gallery
Here are some ways in which you can use the Report Gallery to find reporting options:
- Browse the thumbnails to find formats that suit your needs
- Use the filter to search for keywords, like summary, trend, change, distribution or action planning
- Tap/click on individual thumbnails to drill down for more details
- See different formats of the same report
- Discover related reports by clicking reports in the the Related reports section on any Report Details page. (You can also move the mouse over the names of related reports to see a mini thumbnail to guide you.)
Let ReportGorilla help you choose
While the ReportGallery shows the full range of different report styles, ReportGorilla can use it's built-in intelligence to narrow down the options for you.
When you select your survey, ReportGorilla pre-analyses it and works out which reports are a good match. You can browse them, just like in the Report Gallery. To take it to a different level, you can also create fully realistic previews of these reports, as Web pages, PowerPoint, Word or Excel files you can edit, or just chart or table images you can use in other documents. This way, you'll see exactly how your reports will look and be able to proceed with confidence.
Once you have found the reports or slideshows you want, you can instantly create versions using your real data and be ready to share findings, gain insights and make better decisions.
Try ReportGorilla with your surveys now
New insights from old data
You can try previews with your old surveys too. It's a great way to see what ReportGorilla can add and you may even gain some new insights from that old data. It's never too late to learn.